Precision in trading
usable for anyone
Currently under development for web and mobile.

What's in Abacuus?
Here is everything you need to trade confidently.
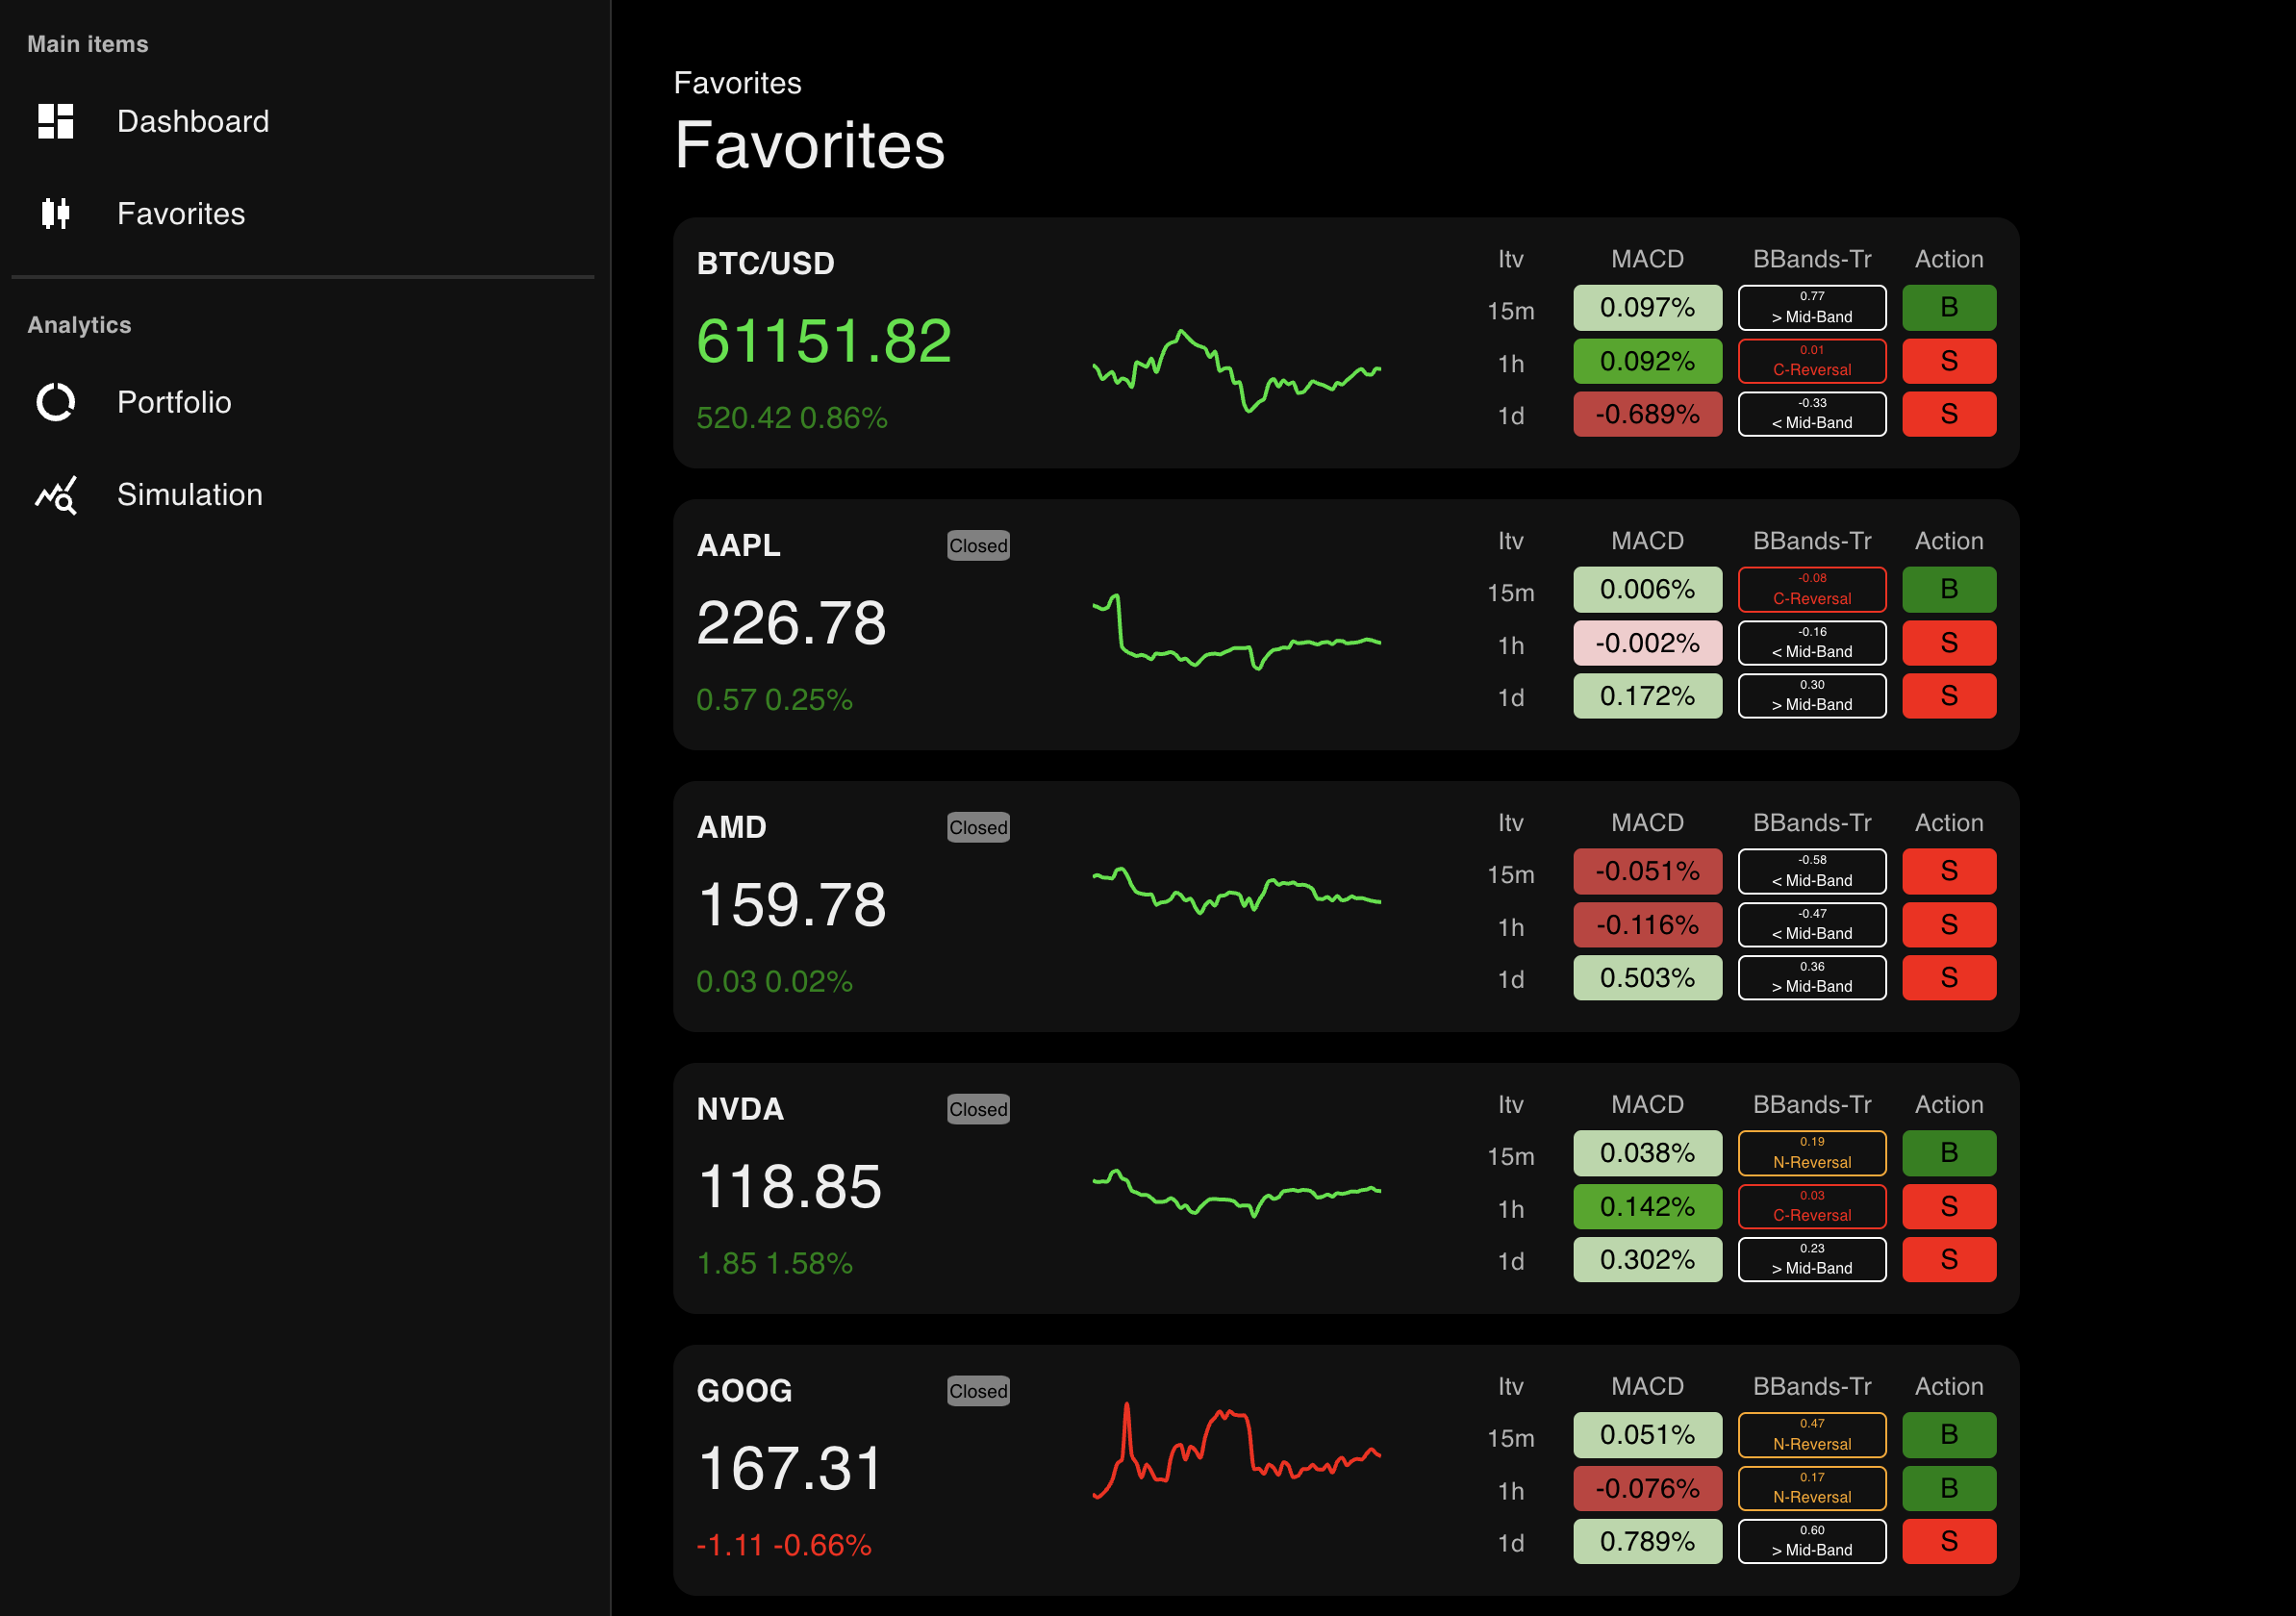
Favorites
Your favorite stocks and ETFs.
Momentum indicator that shows the relationship between two moving averages of a security's price to identify trend changes and potential buy/sell signals.
Volatility bands, plotted above and below a moving average, expand and contract based on market volatility, helping to identify overbought and oversold conditions.
Measures the speed and change of price movements, indicating overbought or oversold conditions when above 70 or below 30.
Compares a closing price to its price range over a specified period to identify potential overbought or oversold conditions.
Shows the average price a security has traded at throughout the day, weighted by volume, often used as a benchmark for intraday trading.
Strategy
Customize your strategy with your own rules.
Analysis
Monitor real-time stock performace.
Notification
Get notified when the market moves.
Portfolio
Track your portfolio performance.